Ascoli65 Member
  • from Italy
  • Member since May 28th 2016
  • Last Activity:

Posts by Ascoli65

    The 72 W power drop/recovery part is something other than a reactor cooling heating effect, in my opinion, because it took 12000 seconds to raise the power from 60 W to 70 W the first time, and around 1200 seconds the next few times. Without overshooting the previous maximum of 70 W. The largest thermal mass in the calorimeter is the reactor, which as seen from the calibration and excess periods, requires a long time period to change temperature and therefore the outlet air temperature from which power is calculated.


    More similar to someone opening the side panel and putting it back on.


    It's obvious that the overall time constant is dominated by the reactor mass, which is 10x greater than the box mass, but the down spike + recovery transients only involve the box and the air inside it, so no wonder that their time constant is 1/10 of the global one.


    Please consider that the air inside the box, whose exit temperature provides an estimation of the heat produced inside the reactor, is heated by the reactor and cooled by the internal walls of the box. The first delta T is 10x the second one, but the surface of the box walls are 10x to 100x greater than the reactor external surface, so that the temperature of the internal air is very sensitive to the temperature of the box walls, which in turn are very sensitive to the velocity of the external air. Therefore during the down spikes, only the box mass is involved in the transients, not the reactor mass. The temperature of the reactor is not affected, because the internal air always flows at the same speed and the delta T between the reactor and the internal air is much greater than the temperature fluctuations of the box walls.


    You have the opportunity to easily verify this behavior by testing it. If you wish.

    You don't think they controled for variations in AC and aren't most labs where sensitive temperature related measurements are made have special conditions to avoid your proposed excuse for dismissing the evidence?


    The scarce effectiveness of the "special conditions" set in the INFN lab to control the ambient conditions is documented by the trend of T_Room (green line) in the graph shown on my JPEG.


    As for the cabin at Kobe lab, the temperature was much better controlled, probably too much. When there are hot parts, such as in the INFN and Kobe experiments, the main problems arise from the air speed, not the air temperature. Changing the air speed to control the air temperature is detrimental.


    Now a question for you. How do you explain (in the simplest possible way, of course) the fact that, during the H-CNZ#1-2 test, held on September 19, 2018, the down spikes in the TC4 curve terminate suddenly at 18:30 ca. (see page 51 of (1)) and, on the contrary, the TC4 temperature during the H-CNZ#1-8 test, held on October 1, 2018, has no spikes (see page 59 of (1))?


    A hint: you can find the temperatures in Kobe here: https://www.timeanddate.com/we…istoric?month=9&year=2018


    (1) https://www.researchgate.net/p…_of_Nano-Metal_and_HD-Gas

    As was discussed on this thread earlier, bubble foil is terrible as insulation if it can conduct heat anywhere. The reflective properties of bubble foil are only effective when used with an air gap on both sides, in still air. (The R value of bubble foil is 1.)


    So, you are confirming that the calorimeter at Hokkaido University of Science is totally inadequate to isolate the interior space from the external air.


    Is it possible, in your opinion, that the 3 down spikes at the end of the "excess heat" test at 72 W, held on October 23, were simply caused by the late activation (during the evening) of a fan heater, operated in an on-off cycle?


    Couldn't be possible that the regular trend of the corresponding calibration test at 72 W, held on December 2, does converge to a lower value due to the permanent activation from the beginning of the same fan heater?


    (Here you can find the temperatures in Sapporo: https://www.timeanddate.com/we…storic?month=12&year=2019 )

    I am attempting several sorts of artifact inducement. So far the calorimeter is remarkably robust.


    My box currently has an air gap between the exterior bubble foil and the acrylic box, so outside influences are minimal. The interior acrylic can heat up, but transfers little to the outer surface (or vice-versa, presumably). Previous tests showed about a 10% improvement in heat recovery from adding the air gap.


    Previously, before the air gap was introduced, active cooling of the outside would probably have lowered the maximum interior temperature, and therefore decrease the outlet air temperature.


    Thank you.


    Your box is much better insulated than the Saito calorimeter shown in Figure 1 (1). The latter has a metal frame, probably in aluminum, and only one layer of bubble foil which separates the interior space from the external air. Needless to say, I would be very curious to see what would happen if you remove the interior acrylic box and leave only the exterior bubble box. Maybe it could be the right sort of artifact inducement to attempt.


    (1) https://www.lenr-canr.org/acrobat/MizunoTsupplement.pdf

    AHEs at NEDO-Kobe. A much simpler explanation is OCEs (Ordinary Cooling Events)


    Here is my answer to the question I asked to the L-F readers before the Christmas holydays (*).

    (btw: HNY everybody!)


    In the paper presented on last September at ICCF22, Takahashi et al. observed that:

    From https://www.researchgate.net/p…-Metal_and_HD-Gas_revised


    In Fig.4, we show temperature evolution data for the #1-2 burst event. Obviously, the behavior of TC4 is very strange with many oscillatory down-spikes….

    … The oscillatory TC4 fluctuation looks chaotic as you see in Fig.7.

    This is regarded as an indication of strong local AHE, which makes H-gas turbulence by generation of chaotic up- and down-stream-paths of convection gas flow in RC.

    and concluded:

    As new findings, the H(D)-gas turbulence effect in reaction chamber (RC) under strong AHE power becomes strong in our C-calorimetry system, when we have met strong local AHE power evolution in RC. This gas turbulence effect cooled the RC upper flange and generated chaotic temperature evolution of TC4 upper flange temperature and mostly decreased oil-outlet temperatures monitored at TC1 and TC2. …

    Origin of AHE can be regarded as some nuclear origin …


    Well, IMO a much simpler explanation of the TC4's oscillatory fluctuation is provided in the following JPEG.

    AQyK4n6.jpg


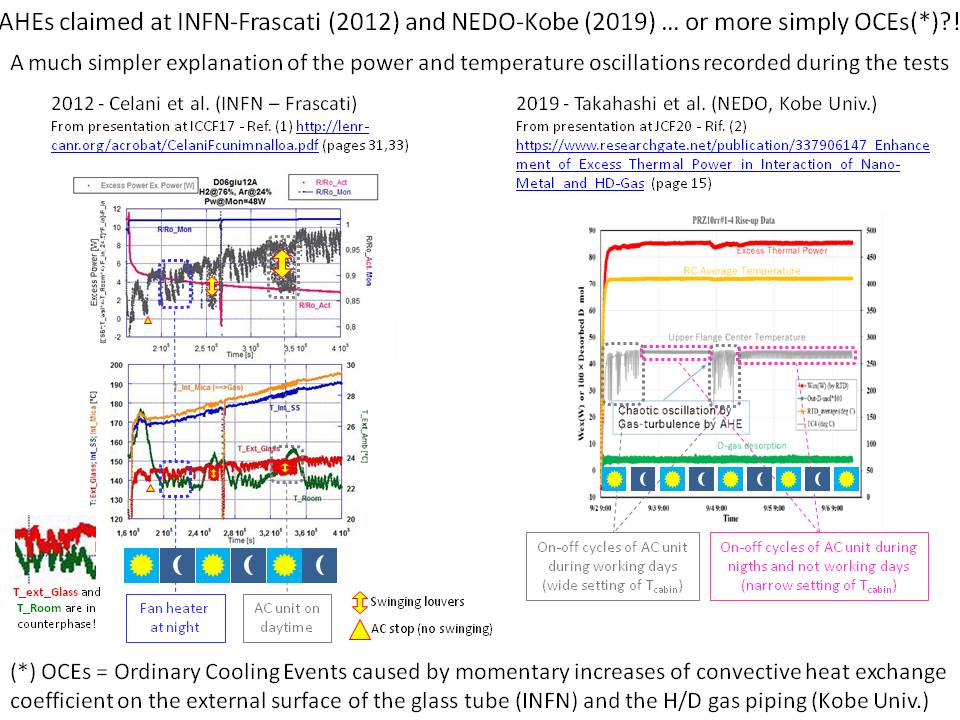
    With reference to the right side of the JPEG, there is no need to postulate the existence of any nuclear AHE to explain the oscillatory behavior shown by the TC4 signal on many graphs of the most recent paper published by Takahashi et al. (1). The sequence of down spikes can be easily interpreted as the effect of Ordinary Cooling Events (OCEs) due to the intermittent operation of an Air Conditioning (AC) unit installed inside the cabin which hosts the Kobe's calorimeter. The on-off cycles are triggered by the ambient temperature settings. During the ON-phase, the MHE reactor is hit by an air flow at high speed which increases the convection heat exchange coefficient h on its external surfaces, by a factor many times higher than natural convection level. Due to the experimental set-up, this increased h causes a rapid cooling of the H/D gas pipe, which is welded on the upper flange of the Reaction Chamber (RC), whose temperature is measured by TC4. This flange is probably insulated from the rest of the RC cylinder by a non-metallic o-ring, so that its temperature is much more sensitive to the temperature of the external pipe, rather than the temperature of the rest of the RC cylinder. Successively, during the longer OFF-phase of the AC cycles, the coefficient h decreases to the level of natural convection and TC4 slowly go back to the higher base temperature. These alternations determine the typical behavior of these down-spikes, each one is formed by a rapid and shorter segment of a decreasing exponential branch, followed by a slower and longer segment of a rising exponential branch. They are just a manifestation of the cooling (and heating) law known since Newton's times!


    As for the specific graph presented on the JPEG and extracted from page 15 of the most recent presentation of Takahashi et al. at JCF20 (1), the 2 periods of wider oscillations correspond to possible working hours. So, the larger amplitude of TC4 oscillations can be due to a wider values of the temperature settings of the AC unit during the presence of personnel in the cabin. During nights and the days with no human intervention inside the cabin, the AC cycles exhibited a regular pace triggered by a narrower settings of the on-off thresholds.


    The NEDO-Kobe oscillations of TC4 are very similar to the power oscillation presented by Celani at NIWeek2012 in Austin, TX (2a) and at ICCF17 in S.Korea (2b), which are shown on the left side of the JPEG. There are a couple of main differences. As shown by the red curve, during the test, held at the beginning of June 2012, a fan heater was cyclically activated to avoid T_Room decreasing below 22°C during the nights. During these cycles, the T_Ext_Glass and the T_Room are in counterphase, ie, while the fan heater is ON, the first decreases and the second rises. This apparently contradictory behavior shows that the value of T_Ext_Glass, which was directly used to estimate the power output (black curve), is heavily affected by the velocity of the air flowing around the hot glass tube, which increases the coefficient of convective heat exchange and causes large drops of the glass temperature.


    Conversely, during the warm days of June, the temperature in the lab rose to 25-27 °C and the AC unit was activated. In particular, during the 2nd and 3rd days, the large and frequent oscillations of the T_Ext_Glass temperature (red curve) and the Power output (black curve) are easily explained by the swinging of the louvers of the AC unit.


    In conclusion, the ordinary cooling effects due to a discontinuous operation of the HVAC units are able to easily explain the oscillatory behavior of the curves presented as AHEs by Celani in 2012 and Takahashi in 2019. The same trivial phenomenon is also able to explain the results obtained by Saito et al. when they tested the Mizuno's cells at Hokkaido University of Science (3).


    (*) The NEDO Initiative - Japan's Cold Fusion Programme

    (1) https://www.researchgate.net/p…_of_Nano-Metal_and_HD-Gas

    (2a) https://www.youtube.com/watch?v=Xe5rcEvsek0 [at 4:06]

    (2b) http://lenr-canr.org/acrobat/CelaniFcunimnalloa.pdf

    (3) MIZUNO REPLICATION AND MATERIALS ONLY


    As for the Mizuno argument, I will answer to your senseless provocations in the devoted thread (*).


    To remain in the topic of this thread, what about the cause of the oscillations in the work presented at JFC20 by Takahashi et al.?


    (*) MIZUNO REPLICATION AND MATERIALS ONLY

    Ascoli has neither the nouse nor the subtlety nor the inclination to identify

    a truncation error

    which Jed talked about in 2017 in that spreadsheet


    I was not the only one who failed to notice the truncation error:

    From RobertBryant - Mizuno Airflow Calorimetry
    […]

    Honestly . I worked through this same spreadsheet 2 years ago and

    didn't notice because I was working at 3 sf precision,,and

    the main focus was on the delta temperatures...not the VxI.


    It happens.


    Btw, any reference to JR talking about the truncation error in his spreadsheets?


    Quote

    it alleges vexatiously that it is due to pasting..


    Where are the values measured by the Yokogawa wattmeter?!


    A sort of "forensic" evidence was finally provided by LENR Calender who detected the difference in the numeric formats used in the two spreadsheets of the control and active tests at 120W performed in May 2016. As I had immediately explained (*), the basic mistake came from JedRothwell, who published the spreadsheets with different formats. A second mistake was that JR did not revealed this numeric incongruence, when he was asked to explain the differences between the "Input power" curves of the control and active tests (**).


    But these are not the major errors related to these spreadsheets. If confirmed that both the columns of the "Input power" contain the product V*I, all the hypotheses raised about the spreadsheet of the "active test" apply also to the second spreadsheet, that of the "control test". So, the error doesn't disappear, but it doubles!


    You continue to ignore that the paper describing these tests contains the following paragraph:

    From https://www.lenr-canr.org/acrobat/MizunoTpreprintob.pdf (emphases added)


    "The rectangles in the lower left of the figure represent the input power supply, the power input analyzer (Yokogawa, PZ 4000), the data logger (Agilent, 34970A), and the PC for data acquisition. […] Data from six reactor temperatures, electric power to the test reactor that is processed by the power-meter, electric currents and voltages for the power supply of the blower, and the temperatures of the inlet and the outlet air flows were collected by a data logger and recorded to a PC every 5 s."


    If the "Input power" columns in both the spreadsheets show the V*I product, it means that the data of the electric power to the test reactor that is processed by the power-meter, ie the data measured by the power input analyzer (Yokogawa, PZ 4000), don't appear in the published spreadsheets.


    Where are the values measured by the Yokogawa wattmeter?


    I can imagine only two possibilities, either:

    A) contrary to what has been reported in the paper, it is untrue that they were collected by a data logger and recorded to a PC every 5 s, or

    B) they were deliberately not included in the spreadsheets or they were removed from them.


    Make your choice (or propose a third possibility).


    (*) Mizuno Airflow Calorimetry

    (**) The NEDO Initiative - Japan's Cold Fusion Programme

    Jedrepeatedly told the truth


    JedRothwell was asked to provide an explanation for the differences in the data of the two spreadsheets in the same post where I noticed this difference:

    From Mizuno reports increased excess heat , dated August 7, 2019


    […]


    Well, as you understand, this situation raises a very critical question: why are the wattmeter readings reported only on the control test spreadsheet and the active test spreadsheet contains the results of the product V/DC*I/DC?


    Can you please provide an explanation or maybe ask Mizuno?


    JR was the one who published the two spreadsheet in September 2017. He has the original spreadsheets and could have easily answered my question, by saying that he had posted the two spreadsheet with a different number format, but he didn't provide this explanation. On the contrary, he only insisted that 3 or 4 different instruments had provided nearly the same value of the power. This response left the substitution of the input power in just one of the spreadsheets as the only plausible explanation for the difference in their data.


    A plausible (not necessarily the real one) explanation was provided only on September 16 by LENR Calender, who pointed out the difference in the numerical format between the two spreadsheet.


    This same explanation could and should have been provided by JR after my first request. On the contrary, he provided contradictory versions about the use of the Yokogawa wattmeter (*), the only instrument suitable for rapidly changing input power, and this fact fed the suspicious about the information contained in the spreadsheets. This suspicious has not been solved by LC finding, because if it is confirmed that the "Input power" values reported in both the spreadsheets derive from the product V*I, it means that both the original records of the Yokogawa wattmeter were lost, or not even recorded, contrary to what is reported in the Mizuno paper.


    Can you understand? In this case the situation would be even worse!


    (*) Mizuno Airflow Calorimetry


    This was such a huge waste oftime…and yet Ascoli65 still continues its bluster on this forum


    This thread is devoted to discuss the Takahashi results, not Mizuno's. Any idea about the TC4 oscillations?

    Simplest (but probably unlikely) answer is a dysfunctional thermocouple, possibly damaged by H/D absorption?


    Simple but impossible. A dysfunctional thermocouple doesn't show those oscillations, featuring a constant pace for long periods. Moreover, it's not in contact with the H/D gas. It's glued to the outside of the upper flange (or the connected pipe).


    A clue. It seems to me that TC4 is the only thermocouple measuring the temperature of a metal component, the upper flange, which is soldered to a metal and not thermally insulated tube coming out of the reactor cell.

    The point I'm trying to share is that there are no defined boundaries in the study of matter,


    I agree. People can study this important topic as they like, crossing any established boundary, if they are able to, just staying within the limit of the resources provided by public and private funding.


    Quote

    We need to understand nuclear physics, photonics, chemistry, and dense matter physics in order to understand these excess heat/light/electricity claims. I may be pushing a few buttons but this is a lot more than Fleischmann and Pons.


    I disagree on this specific point. Before resorting to sophisticate knowledges, such as nuclear physics, photonic, etc., to explain the claims of excess heat (or any other quantity) you need to be sure that this excess is real by considering all the simplest possible hypothesis, including errors and artifacts. It's just common sense. No bazooka is needed to kill a mosquito.


    Quote

    Holmid may just have a more productive way of accomplishing the same ends that sporadic excess heat experimenters want and he has a university lab in the western world. And people getting PhD in his work funded by Nurront.


    The reasons for Holmlid research are evaluated by his university and his funders. I can't contest them.


    However, some abstracts of his vast literature end with sentences like this: "If spontaneous nuclear fusion or other nuclear processes take place in D(0), it may give rise to the high-energy particle signal. Low energy nuclear reactions (LENR) and so called cold fusion may also give rise to such particles."


    I find this reference to controversial (to say the least) phenomena quite hazardous and harmful to his studies. I wonder who can be encouraged to go through the main text after having read this kind of premise.


    Anyway, this thread is not dedicated to Holmlid but to the latest results presented by Takahashi and his team at JCF20. Their presentation includes 8 graphs in which the downward peaks aligned along ordinary temperature curves are interpreted as "Chaotic oscillation of TC4 by Gas-turbulence by AHE". Well IMO these oscillations are neither chaotic, nor anomalous and not even due to heating events. So, I've asked the other L-F members, if they could propose a simpler explanation, not a more complex one. Any suggestion?

    Ascoli65 Your unwillingness to even just read something new and your obviously greater than necessary confidence in self/mainstream will be a great hindrance to your understanding, whether people answer your questions or not. Watch the videos i posted of his colleagues and at least skim an abstract written by him before dismissing it outright. You have an attitude towards the "most mainstream documented" recent LENR researcher that is similar to an antediluvian outside the ark lol. It's never going to rain is it...? Of course that is a common conservative approach in human psychology so no one is holding it against you hopefully. Appreciate new knowledge, turn a new Lief or leaf!


    Since January 2011, I've read a lot of new stuff. But I'm interested in CF/LENR, not nuclear physics. More precisely I'm interested in the claims of excess heat made by the CFers. I don't deny that nuclear physics is a wonderful subject of research, in which it's still possible to make other interesting discoveries. But CF is essentially the search for heat in excess of normal electrochemical sources. Therefore, the first step in this field is the confirmation of this excess heat. Only after having excluded any conventional cause or possible artifact for the apparent XHs or AHEs, does it make sense to speculate and investigate on a possible nuclear origin.


    As already said, I've not found till now any heat claim - from a milestone in CF research such as the F&Pìs "1992 boil-off experiment" to the recent AHE peaks claimed by Takahashi et al. at JFC20 - which could not be explained in a conventional way, including possible errors. So, I see no reason to devote some of my time studying Holmlid, who is not even mentioned in the Takahashi presentation discussed in this thread.

    It's learning time - also for paid hot fusion troll's. [...]

    [...]

    Do you suffer from hallucinations? [...]


    Curbina and [...] like this.


    The real hallucinations are those contained in your rants against me. But this is nothing new, just reveals once again the low level of your arguments. What I'm curious to know is if the like from Curbina, who is a moderator, is also aimed to encourage this kind of arguments.


    Quote

    Why not reading some Holmlid papers that show the generation and measurements of moving H*/D*?

    May be you mixed up the answer: You wanted to say: I don't believe in atoms with negative energy...


    No. I wanted to say what I said. I have heard of Holmlid, but I have not heard of his strange H*/D*, because I haven't read his papers. Why should I?


    I've been following this fascinating field since January 2011. The artifacts which caused the excess heat claimed in that first public demo of the E-cat were easily explainable by applying elementary notions of thermodynamics. Any other consideration on Ni, H, the secret sauce and any extravagant supposition about their nuclear interactions were just a waste of time and highly misleading.


    In my experience, this approach worked egregiously with all the other CF/LENR experiments I have examined in the following years: Ecat (the other 2011 tests), Celani (2012), MFMP (2012), F&P (1992) and, more recently, Mizuno (2016). IMO, provided that sufficient info are available on the Web, plausible trivial explanations for the artifacts behind the alleged XHs can be found, by just applying the basic laws of thermodynamics and electricity.


    It seems that the same also applies to the downward peaks presented as AHE effects in many slides of the JCF20 presentation by Takahashi et al (1). I think that it's possible to explain them without imagining exotic states of atoms and other nuclear extravagances.


    Quote

    Why should in a normal pressure atmosphere just in one location the temperature sink by 100C ?? Cooling can only happen by an even cooler medium.

    Why moves H*/D* upwards? Simply by convection because its heated/produced by the fuel...


    Just out of curiosity. Are you saying that the H*/D* atoms escape from the lattice of the powder grains and move upwards? Are you also implying that they cool the upper flange because they are colder than the surrounding material? If this is the case, why does none of the 4 RDT, which are directly immersed in the powder, show the same trend (see page 12 of presentation at JFC20)? Furthermore, shouldn't the colder H*/D* atoms move downwards by buoyancy?


    (1) https://www.researchgate.net/p…_of_Nano-Metal_and_HD-Gas


    Thanks for the answer. Very interesting.


    So, you confirm that the negative spikes in the TC4 signal must be interpreted as caused by a mysterious nuclear phenomenon mediated, in this case, by an exotic status (H*/D*) of hydrogen isotopes. Don't you?


    It seems very unconventional and strange to me. Never heard of excited atoms with negative energy. Not clear how "H*/D* is traveling upwards to TC4". And what is it traveling? Excited atoms outside the metal grains or excitation state of the hydrogen atoms in the grain lattice. And why upwards? Are these atoms or state sensitive to gravity?


    Furthermore, what about the similar negative spikes in the Celani's curves? Are they also due to H*/D* atoms or states? How do they travel from the constantan wire to the reactor tube surface? This tube is not made of steel. Is it glass another ideal partner for H*/D*?


    Anyway, the temperature curves published by Celani (1) and Takahashi (2) strongly suggests that the negative spikes are caused by the same phenomenon. But I think that, before considering any extraordinary nuclear mechanism, we should first investigate the possibility that these spikes are due to a more conventional and mundane cause. IMO your post contains the right hint to the real cause, but, no, it has nothing to do with H*/D*.

    9z5Rmyd.jpg


    Can anyone else of our fellow L-F members suggest a more common explanation for the common behavior of these temperature oscillations?

    (1) http://lenr-canr.org/acrobat/CelaniFcunimnalloa.pdf

    (2)

    https://www.researchgate.net/p…_of_Nano-Metal_and_HD-Gas

    AHEs claimed at INFN-Frascati (2012) and NEDO-Kobe (2019) – What’s in common?


    Some of the slides presented by Takahashi et al. at JCF20 meeting recall the results presented by Celani at ICCF17 in 2012. The following jpeg shows these analogies:

    Wvyx5yH.jpg


    The two graphs on the left come from pages 31 and 33 of the Celani presentation in South Korea (1) and have been included in many of his other documents published in the following years. They are also explained in a video (1a) filmed at NIWeek12 in Austin (TX) a few days before the ICCF17 (at 4:06).


    The graph on the right is taken from one of the many slides of the JFC20 presentation (2) in which the oscillations of the "Inner Flange Center Temperature" (or "TC4") are defined as "chaotic" and associated to AHE.


    As described in the two cited presentations, the two specimens and the two experimental setups are quite different. In the Celani experiment, carried-out in his lab at INFN in Frascati, the active specimen was a thin constantan wire placed inside an air-cooled horizontal glass tube. In the Japanese experiment, carried out in the NEDO lab at the Kobe University, the specimen was a heavy bunch of Ni-Pd or Ni-Cu powder placed inside a vertical oil-cooled stainless steel reactor.


    So, apparently, many of the main features of the two experiments were different, but the temperature oscillations shown in the jpeg seem very similar to each other and are both attributed to some kind of Anomalous Heat Effect.


    What could be the common phenomenon which produced these similar behaviors?

    (As for my opinion, I strongly doubt it is of nuclear origin.)


    (1) http://lenr-canr.org/acrobat/CelaniFcunimnalloa.pdf

    (1a) https://www.youtube.com/watch?v=Xe5rcEvsek0

    (2)

    https://www.researchgate.net/p…_of_Nano-Metal_and_HD-Gas