LDM Member
  • Member since Apr 29th 2017

Posts by LDM

    Because the Court Case had nothing to do with whether the Lugano test was flawed.


    Then why did representatives of IH try to bribe Dr. Levi to withdraw his support of the Lugano Report ?


    See : PLAINTIFFS’ MOTION FOR SANCTIONS FOR BAD FAITH LITIGATION CONDUCTCase 1:16-cv-21199-CMA Document 167 Entered on FLSD Docket 03/09/2017

    It always amazed me that such seemingly intelligent businessmen could be so easily manipulated by a conman.


    Why did such seemingly intelligent businessmen when confronted with a court case against him not show in court that the Lugano test was flawed ?

    As Para stated, with the Optris ravi files it would take about 10 minutes to do so.

    And that would have been very strong evidence against Rossi.

    Maybe it is telling that IH did not take that route ?

    In earlier posts I have come to the conclusion that the MFMP Lugano thermal simulation must have been wrong and that this was possibly due to the cast being a not pure (composite) Alumina or being casted of another ceramic type.

    In my last post on this subject ( post #736 ) it was again shown that the total emissivity of the MFMP cast must have been substantially lower then that of standard Alumina


    Looking at the published type of cast published by the MFMP ( Cotronics RTC-60 ) and the picture Para showed in one of his posts (RTC-70) I tried to imagine which characteristic of the cast material could have been of influence on the total emissivity if their dogbone had indeed being made by one of these casting materials.

    One of the possible characteristics of these casts is their very small grain size which is especially true for RTC-70 which is designated as ultra-fine.

    I seem to remember, but can currently not find that information, that the grain size of the Cotronics RTC-70 castable was 2 um. That is a very small grain size for a castable, so I wondered what the influence of the grain size would have been on the total emissivity.

    The only information I found was the following table which gives some indication of the influence of grain size on total emissivity of Alumina at a temperature of 1200 C


    As can be seen a small grain size lowers the total emissivity quite a bit.

    I don't know if it also lowers the Optris in-band emissivity, but if so it is another possible explanation for the higher temperatures measured by the MFMP.

    Keeping distance


    Yesterday a train im my country (Netherlands) became too crowded which resulted in passengers being too close to each other.

    The train conducter then asked some people to leave the train, which was refused,

    He then called the police which disembarked the whole train which then contined his ride without any passengers on board.

    LDM


    Political games come in many forms. Here in the UK I see evidence that office-holders in our current government are seeking to spread the blame for their failures by repeating the mantra 'we are being guided by the science'. Meanwhile the scientists at the front line are saying' the government isn't listening to us'. They have also make an offer to the leader of the (socialist) opposition to help then, which he has agreed to do. This serves to mute critical commentary and spread the inevitable post-crisis accusations of incompetence over a larger group. So it would be wrong to think that party politics has been set aside, it is just that the players are now dealing cards from the bottom of the pack.


    I am following the news on BBC TV quite closely during the day and agree with your analysis what is happening in the UK.

    I think that that is likely due to having basically only two main politic parties.

    However my impression is that in my country, where we have may parties which we can choose from this is not happening.

    I see no possible intentions to put the blame for what happens on somebody else, nor comments from opposition parties supporting this, nor intentions to limit blames for after this crisis is over.

    On the contrary, most comments/remarks, also from the oppistion parties are mostly sincere questions which get sincere answers.

    It is very very unfortunate that COVID response has become a political issue in the US.


    Indeed,


    Political games should not be played in these times.

    In my country (Netherlands) our minister of medical care became overtired during this crisis and had to withdraw hinself from his function.

    Instead of picking a new candidate from the coalition parties as usual the governement looked for the best person suited for the job and found out that the best person was from one of the opposition parties.

    They invited him to take up the post and he accepted.

    He is now our new minister of medical care.

    This post tries to come up with some theoretical background on the ECAT plasma reactors.

    It assumes that the plasmas in these reactors where thick plasmas.

    We have however no proof that this was the case.

    Nevertheless ...


    Plasma :


    There are basically two types of plasmas, thin Plasma and thick Plasma.


    In a thin Plasma the density of the Nuclei in the plasma is such that radiation inside the plasma can largely be radiated out of the plasma without being blocked by the nuclei.

    This results in that the spectral discharge lines are separately visible.


    In a thick plasma the density of the nuclei is such that most of the inner radiation is reabsorbed leading to an equilibrian of inner radiation and the radiation leaving the plasma is largely from the surface of the plasma.

    This leads to a special shape of the intensity as a function of the frequency profile.

    Such a profile is shown in the following figure.


    -------------------------------------------------------Figure 1


    The curve is largely flat.

    At the higher thermal cutoff frequncy the intensity drops of very fast.

    At the lower side the intensity drops off less fast.

    Note that spectral lines with frequencies higher then the upper cutt-off frequency will still be shown.


    Plasma temperature

    Plasma temperature is due to the mobility of the electrons in the plasma.

    Plasma temperature can be expressed in degree Kelvin (K) or in electron Volt (EV)

    relationship between both is 1 eV equals 11605 degree Kelvin.


    For the higher frequency cutt off as shown in the above figure the relationship between the cut off frequency and the plasma temperature is given by the following formula


    ν = 2.8E10 x T----------------------------1)


    This makes it possible to calculate the plasma temperature based on a measurement of the radiation as a function of the frequency using the upper cutt off frequency.


    If the radiation of a thick plasma is uniform from the surface then it can be theoretical shown that the total radiation can be calculated with the following formula.


    Q = A σ T4---------------------------------2)


    See "Plasma Physics and Engineering" by Alexander Fridman and Lawrence A.Kennedy

    Chapter 6.7.9


    Now wait a moment !

    Formula 2 is the same formula as for calculating the radiation of a black body !

    I wonder if nature wanted to play a trick on us because this can lead to some people believe that a thick plasma is a black body.

    However it isn't , as can be seen the shape of the spectrum of a thick plasma as shown in figure 1 is completely different from that of the radiated spectrum of a black body as given by Planck's law.

    Only the formula for calculating the radiated energy is the same.


    If you based on formula 2 wrongfully consider the thick plasma to be a black body then you are possibly also intended to calculate the peak wave length of the black body radiation using Wien's displacement law.

    However this calculated peak wavelength does not exist for the plasma, it is virtual and can not be measured or shown.

    It can only be used as a comparason value if you want to compare the thick plasma with a black body.

    And reporting such a virtual wavelength can lead to confusion when people do not see this peak frequency in the reported spectrum.

    You are completely wrong, frequency and active power are two different circuits, parameters and measures.

    PF depends on active power negative value, not from frequency measure.


    You are completely wrong, frequency and active power are two different circuits, parameters and measures.


    The PC-830 calulates the power by splitting the waveform into Fourier components and then summing the powers of each Fourier frequency component.

    Note that both the real power and apparent powers are calculated in this way.

    So in the way the PC-830 calculates the total power, frequencies and powers are inter related.

    Basing the power calculation on the fourier components means that if the measured frequency components are wrong then the power calculation will also be wrong.


    PF depends on active power negative value, not from frequency measure.


    PF does not depend on the "active power negative value" but on the cosine of the phase angle between the real power and apparent power.

    Since the ECAT heaters are resistive, the phase angle is about zero which means that the power factor should be about 1.

    Negative power factors occur only when more power is returned then supplied which is not the case for an ECAT but could be the case at your home if your solar panels supply more power then you are consuming and the excess solar power is returned to the grid.

    Thus a negative value could in the example showed only have occured due to a miscalculation resulting from the wrong calculated Fourier components.

    LOL,

    LDM ignored also negative active power indication PΣ and negative Power Factor PF, both impossible parameters. sign of an acquisition set-up completely unreliable.


    I indeed intentional ignored those indicators but had seen them.

    But those likely where the result of the wrong frequency determination and as I stated as a consequence the measurement data was wrong. ( including the negative signs ).

    But if you had already noted it, why did you not post your findings an tel us the TRUTH.

    Supposedly is not a measurement.


    This image shows what is supposedly ~360 W input.

    .
    8211-dec-14-pce-jpg


    Instead it shows the ecat producing over 1 kW, and was totally ignored by the Professors.


    Don't know when and where this picture was taken.

    However the screen layout suggests that the PCE-830 is in 3 phase, 3 wire mode.

    Voltage of about 240 Volt suggests that the measurment took place in Europe and thus that the mains frequency should be 50 Hz.

    However the PCE-830 shows a frequency of 5.3 Hz !

    Normally you set the frequency on the PCE-830 to a fixed mains frequency of 50 Hz (Europe) or 60 Hz (USA).

    In that case the the display will show 50 F or 60 F, the F meaning that the frequency is set fixed.

    In the picture shown the display shows 5.3 A, the A meaning that the PCE-830 is set to automaticcaly trying to determine the frequency.

    And it is failing to do so, probably due to the a non sine current wave form.

    It will now use the 5.3 Hz as the base frequency for determining the higher order harmonics and these will be incorrect.

    As a result the presented measurement results will also be incorrect.

    So if the results presented in the display where ignored, then that was a correct decision.

    They have no comment since 10 years.


    Incorrect. In the UNSWORN DECLARATON OF GIUSEPPE LEVI in the court documents Levi made a comment about the critique on the Lugano test.

    Maybe not detailed answers we all expected, nevertheless it is a comment.

    You are telepathic! We are vacationing and just played yesterday in Tucson. And I appreciate you using the correct word Skeptic rather than Pseudo skeptic.


    Don't let yourself being distracted by all the comments on this forum while having vacation.

    Tucson is a nice place to visit. Many thing to do in the city and the surroundings.

    Went several times there when I was living in Arizona.

    As I wrote earlier, if new idea's arise I would pick up this thread again.


    For several reasons I did not find any reason to do new Lugano based calculations nor find the time to continue studying atom theory as I intended.

    But in between I did a new investigative calculation on the second MFMP thermal dogbone test.

    The calculation is based on the DB_test3_TC test.

    Note that this calculation is indicative, not exact due to the unknown heat distribution in the MFMP dogbone for the used power of 300 Watt.


    see : https://drive.google.com/drive…xJkjesxe4kXzczVnlfajhjbDQ


    We start with a calculation on the heater coil of the MFMP dogbone.

    Specifications are :


    Diameter 11.1 mm

    Windingen under ribs : 76.5

    From the coil specificatione we derive a total wire length under the ribs of 265.05 cm

    Total wire length in the dogbone : 273.05 cm (two times 4 cm in the end caps added)


    This means that 265.05/273.05 = 0.971 of total coil power is dissipated under the ribs

    (Did not take into account the heater wire length outside the dogbone since it is not known)


    From the DB_test3 we use for our calculation the last value for the 300 watt applied power.

    (sample number 147)

    The important data :


    Optris temperature-----------------505.4 degree C

    Applied power------------------------300.24 Watt


    The power under the ribs is now calcualted as 0.971 x 300.24 = 291.5 Watt

    We have 10 measurement sections, thus the power per rib section = 29.15 watt


    For the temperature of 505.4 degree C with an ambient temperature of 17.5 degree C the calculated convective heat transfer coefficient is 13.49

    Due to the ribs being close which reduces the convective heat transfer we have to correct this with a factor 0.735 which brings the value to 0.735 x 13.49 = 9.92

    (The value of 0.735 was interpolated from two CFD simulations)


    Area of a section is 0.00263 m^2.

    Thus the disspated convective power is 9.92 x 0.00263 x (505.4 - 17.5) = 12.73 Watt


    Radiated power 29.15 -12.73 = 16.42 Watt (Discarding the limited lateral power dissipation)


    We now us the following formula to calculate the emissivity

    See for an explanation of the formula :


    Rossi Lugano/early demo's revisited. (technical)


    E = σ x Af x e x Fbg x { 1/(1 - (1-Fbg)(1-e))} x T^4


    with---E--------Radiated energy (11.84 Watt)

    ---------σ--------Stefan-Boltzmann constant (5.67·10-8 W/m2K4)

    ---------Af-------Fin area of a section (0.00263 m^2)

    ---------e--------Emissivity

    ---------Fbg-----View factor of ribs to background ( 0.572 )

    ---------T--------Temperature (Kelvin) ( 505.40 + 273.15 = 778.55 K )


    Before we apply the formula we have to correct the Optris temperature reading due to the increase in apparent emissivity caused by the reflection between the ribs.

    The apparent emissivity is

    e' = e /(1 - (1-Fbg)(1-e))


    For the used Optris in band emissivity setting of 0.95 the apparent emssivity becomes 0.97.

    The relationship between temperature and n value as used in the formula given by Optris is given in the following post :


    Rossi Lugano/early demo's revisited. (technical)


    Applying this to the formula given by Optris we find that the real temperature was 499 degree C (772.15 K) with a value of n = 2.311.


    Filling in the found values in the above equation for the radiated energy we find for the emissivity a value of 0.41.

    This calculated indicative value is much lower then the broad band emissivity value of Alumina for the temperature of 499 degree C, the value being 0.65.

    This becomes clear if we plot this value in the graph of the broad band emissivity as a function of temperature for Alumina.

    This is shown in the following figure :


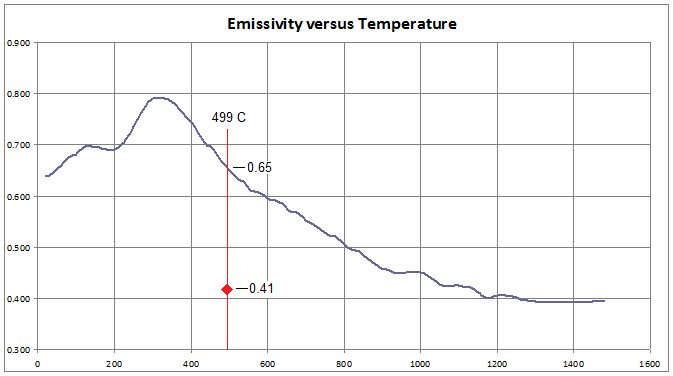
    The much lower calculated emissivity then that of Alumina indicates that the MFMP dogbone was not casted of pure (> 98 %) Alumina, but instead must have contained other components or being based on an other type ceramic.

    The question is then if the MFMP as a part of their test did check if their Dogbone was casted conform their material specification.


    Note :


    As a verification I did a FEM simulation with broad band emissivities set at a value of 0.41 at the middle of the dogbone and got simulated center temperatures of 497 degree C, close to the 499 C calculated from the Optris. It confirms that to get a temperature of about 499 C the emissivity has to be much lower then that of Alumina.


    Add to that that Rossi's partner is targeting the team to become a little less then 100 people in the near future.

    Also note that in addition to their already present surveillance camera's they also installed some very professional intrusion detection camera systems.

    And there is something to be learned from their purchasing activities.


    Have fun ! (I have)

    Hello Robert, robert bryant


    In my opinion your assumed average convective heat transfer coefficient of 4 is too low.

    Calculating the convective heat trannsfer coefficient with the method used in the Lugano report I get different values.

    Note that I verified the Lugano method by Computional fluid dynamic simulation which showed that the method used in the Lugano report was accurate.

    For your sections I get, using the Lugano calculation method, the following results for the convective heat transfer coefficients :


    -LE------1-------2--------3-------4--------5-------6-------7-------8-------9------10------RE

    4.84---6.47---6.90---7.14---7.11---7.00---7.13---7.07---6.91---6.97--6.34--4.68


    Correcting the average powers you calculated with an average value of 4 now gives the following convective power per section


    -LE------1--------2--------3--------4--------5---------6-------7---------8--------9------10-----RE

    3.00---8.27--11.80--14.39--14.08--12.85--14.25--13.62--11.84--12.55--7.42--2.53


    The total convective power now becomes 126.60 Watt

    Total power now becomes 141.53 + 126.60 = 268.13 Watt


    However as I said in my previous post, also the radiated and convective power on the lefthandside and righthandside should be inclused.

    A quick calculation shows that the total radiated and convective power from left and righthandside will be about 20 Watts total

    This brings the total up to 268 + 20 = 288 Watt.


    That is close to the 300 Watt input power


    Robert,


    Did you in your calculation include the dissipated heat of the vertical outher walls ?

    The convective heat transfer coefficient for a vertical wall is more effective and has a value twice that of the round area which you quoted for the left and right ends.

    Including this will increase the total calculated power

    The method used relies in a thermocouple that is in contact with the inner atmosphere of the reactor and thus in contact with H, which we know causes drift (to some extent reversible) in many thermocouples. T


    From the figure in the document we see that the internal thermocouple was a Tungsten-Rhenium thermocouple

    Tungsten-Rhenium thermocouples can to my knowledge be safely used in an Hydrogen environment.


    The following quote on Tungsten_Rhenium thermocuples from Omega, a thermocuple supplier :


    Thermocouple combinations can be used to 4200°F (2315°C) in hydrogen or inert-gas atmospheres

    and in a vacuum.

    While this might seem at first off-topic, it can be related to the fact that the arrangement of the heater in Mizuno systems could potentially have a role in how easily excess heat will be observed or its magnitude.

    If indeed a magnetic field is harmfull to the reaction, then the (cartridge) heater used in Mizumo systems shoud have a bifilair wound coil to minimize the magnetic field.

    It has also been my conclusion that the presence of a magnetic field has a possible negative influence on the LENR reaction


    I once questioned Rossi on this on his blog on the subject, his answer was that he could not give an answer since it was part of a patent application


    The report


    Indication of anomalous heat energy production in a reactor device containing hydrogen loaded nickel powder.


    of the ECAT HT test had several versions, in the last one some additional information was added in the appendix. In figure 3 of the appendix the harmonic patterns for all three phases where shown. The third phase shows no harmonics which means that this phase was not used.

    If the magnetic fields of the other two phases are opposite they cancel which would mean that in such case the ECAT did run without a magnetic field.


    This could als been the case in the Lugano test. If the dummy run was run with all three phases on and the active runs with two phases, it can also explain the large drop in heater resistance which some calculated (wrongly assuming that the active runs where also run with three phases)


    In addition it gives a possible explanation why so many replications failed.


    A long time ago I discussed with Alexander Parkhomov on the subject and he stated to me that indeed the influence of the magnetic field needed further investigation.


    So you might be right