Bruce__H Member
  • Member since Jul 22nd 2017
  • Last Activity:

Posts by Bruce__H

    I will have to get my mind around the statistics to visualize properly what you are getting at it but i can see you raise a good point and it’s interesting.


    Poisson statistics are appropriate for any process where events happen at a particular average rate but at random intervals. Radioactive decay is the perfect example, but so are raindrops landing on a patch of ground or goals in a soccer game. In this case of the SK spectrum, the number of photons arriving at the spectrometer sensor in a given time and within a particular energy range should follow a Poisson distribution.

    It strikes me that Mr Rossi's activities have been particularly careless and brash for the SK roll out. He no longer surrounds himself with technical experts during his events, he relies on old certifications that, on their face, are of no relevance, he makes blackbody calculations based on a 357 nm peak in the spectrum that he hasn't even bothered to fake up.


    I get the feeling that Rossi's efforts are sloppier and less energetic than in the past. It almost seems as though he is going through the motions. Does it seem this way to others too? I wonder if it has to do with his illnesses, which must be exacting a toll on his energies.


    I wonder too about what a con man does when faced with evidence of his mortality. Does a brush with a possibly deadly disease make past motivations for driving the con forward seem shallow? Or does one go ahead with the con simply as part of regaining one's "normal" life?

    StephenC


    I have taken a look at the SK spectra in the file provided by Pekka Janhunen on ECW. These comprise the 17 spectra shown in closeup just following the 15:18 mark in Rossi video. I am now confident that the majority of the variability you noted in the spectra is due to random sampling variability. That is, the spectral distribution of the signal is not varying from acquisition to acquisition, instead it is just that the photons within a particular energy channel arrive at the sensor randomly and since the acquisition period is short relative to the rate of photon arrivals the count tend to jump around.


    As proof of this, if we assume that photons are arriving randomly then the number of photons in each energy channel should be Poisson distributed. An unusual aspect of a Poisson distribution is that its standard deviation is equal to the square root of its average. The ratio of the standard deviation and the average, called the Coefficient of Variation (or CV) should therefore be 1 / [squareroot average]. In the plot below I have calculated the observed CV (shown in blue) of the data by taking the ratio of the standard deviation of counts and the average of counts at each wavelength channel. I then compare this with the predicted CV (in orange) for a Poisson distribution. The two match closely enough to assert that the variability you see in the video is random.


    It’s quite correct that broad peaks and specta features like you showed in the example can come from emission of bound atoms such as in crystals and molecules. Or we can get them from plasmon peaks associated with nano particles of particular materials. But these are at fixed frequencies and and static. What we saw was very dynamic and changing...


    Hi Stephen


    The amplitude of various peaks in the SK spectrum vary from acquisition to acquisition, but the location of the peaks is quite stable. To see this, go to the part of the SK demonstration video below ...


    (

    External Content www.youtube.com
    Content embedded from external sources will not be displayed without your consent.
    Through the activation of external content, you agree that personal data may be transferred to third party platforms. We have provided more information on this in our privacy policy.


    where the narrator is identifying the various views of the system. A closeup view of the spectrum analysis begins at about 15:18. If you choose one of the peaks in the 380-400 nm section of the spectra (even a minor peak) and hold your finger up against it* you will find that that it reliably in every single acquisition screen. Since the amplitude of the peaks in this region average out at something like 20 counts per acquisition screen, I think that a lot of the variability you see could just be random (I'll work that out in a subsequent post).


    *Note: the process of visualizing the different peaks is aided by using the Youtube settings to view the video at twice regular speed. Just make sure that you don't do that for the parts of the video where Rossi is speaking because that turns out to be terrifying!

    LDM StephenC


    Very tough to assess cut-off frequencies in Rossi's spectrum because the high-frequency (short wavelength) end has large, non-thermal emission features that interfere with the continuous part of the spectrum and the low-frequency (long wavelength) end appears to have been monkeyed with.


    I am guessing that Mr Rossi has used some sort of filter that attenuates wavelengths above 430 nm or so. If that is true then the real spectrum could look like this random one I pulled off the internet


    https://www.researchgate.net/f…por-plasma_fig1_265803163


    Imagine that you cut off this spectrum above 430 nm and below about 300 nm and you get something like this ...


    https://uploads.disquscdn.com/…8447ca9488e96db6426a0.png


    I am not suggesting that the complex oxygen-ethanol vapour spectrum is the correct one. Just that a low temperature spectrum with a continuous part having a peak at wavelengths substantially above 357 could be made to look a bit like a higher temperature (i.e., 8111 degrees K) spectrum if the longer wavelengths were cut off somehow. As pointed out before, Mr Rossi needs 8111K in order to argue that his device is putting out 22kW and he needs 22kW, by conventional reasoning, to heat a room of the size he says he is heating..


    Rossi sleeps about 7-8 hours per night. You can see this on his blog as a nightly period of blogging quiescence when he does not make any posts. Throughout the day, Rossi makes between 5-15 posts at more-or-less random times (although with slightly increased probability first thing in the morning). This daily pattern of alternating quiescence and activity follows the local clock. Thus, when Rossi is in known to be in Florida the timestamps (which are listed in US Eastern Time) on his blogposts occur between about 7:30 AM and midnight, whereas when he is known to be in Europe the timestamps occur between about 1:30AM and about 6PM Eastern Time. Going by this pattern, Rossi spent just over 1/3 of 2018 in a European time zone.


    In 2019. so far Rossi has spent all of January and the first week of February the US Eastern time zone (part of which we know was Florida). From about Feb 8 until today (Feb 26), however, he has been in Europe.


    In response to Gerard McEk's question, Rossi attempts to leave open the possibility that he is sleeping 3 hours or less per night. He implies that this is because of the pressure of work. His numerous blog postings, however, tell a different story. Since Feb 8, when he first shifted to the European time zone pattern, his posting activity is quiescent for about 7 hours every night ... just as always.


    So Mr McEk and sam12, no need to worry about Rossi! Despite his preference for working in the US and the intense pressure he says he is under -- filling orders for heat, overseeing his team, and making sure his factories are working to capacity -- he is in Europe right now and sleeping just fine!

    Btw, in retrospective you should read what Rossi claimed about the “Customer” while he ran the Doral charade:

    https://e-catworld.com/2016/02…n-kw-is-very-competitive/


    Fun link. Thanks for pointing it out!


    It has led me to a link that is even more fun .... Sifferkoll's April 2015 blog post titled "First Hand Information from Visitors of the Industrial Heat E-Cat Customer!" http://www.sifferkoll.se/siffe…rial-heat-e-cat-customer/


    The first line says ...

    I know first hand from very reliable sources that themselves have visited the Rossi/Industrial Heat E-Cat customer that the plant works very well.

    Earlier I asked a question ... how many clients does Rossi need to have in order to convince the skeptics? There have been some good answers along the general lines of 'not many if they are believable companies'. I sort of go along with that. I still think that there is a certain amount of space for Rossi to sell conventionally generated heat to companies at a 20% loss so as to make the SK look good to investors. A $100 million check from an investor would then cover the loss.


    I see in the winds, however, an upcoming Rossi dodge. Not something I think will work with a lot of people but nonetheless something I think Rossi is just the type to try and pull off.


    I see that Rossi is putting out the idea that he prefers a single customer using 100 SKs (producing, collectively, about 2 MW) to 100 customers each using 1 single SK. I think he is softening the ground for a future announcement that a single company has indeed been receiving Leonardo brand heat for the past x number of months and that they are happy happy happy to be getting such a good deal. Rossi will then say 100 SKs running for 1 company is just the same as 1 SK running for each of 100 companies when it comes to having the market judge the SK's success. The problem will be that this single company will have some sort of question marks hanging over it. It will be "Bowing Ltd" rather than "Boeing Ltd." and the spokesman will be someone strangely reticent about the nature of their company.


    I predict that this will be the shape of things by sometime next Fall.

    The vertical scale, Counts, is essentially photon hits.


    To get spectral power, then, doesn't each count have to be multiplied by the energy at it's particular wavelength? It may be that my use of the theoretical blackbody spectrum was incorrect because that is showing radiance and that already has this adjustment within it.


    Edit: On the assumptions that the SK spectral data is measured as counts, I have now tried replotting it as energy (by dividing by wavelength). It makes no difference to any of my conclusions since the wavelength doesn't vary much across the quasi-continuous part of the SK spectrum.

    There is no record that indicates that Rossi's fraudulent bankruptcy, precious metals trafficking and money-laundering convictions were overturned. He several years in jail for those crimes.

    I understand that the authorities in FL are hunting for him now and that he has advised them directly that he is out of the country.


    Yes. I believe that Rossi is somewhere in Europe now. You can track him by his posting times on his blog. Time stamps on the blog are for the US Eastern time zone. When his entries begin showing up a 2AM and 4AM you know that he is in a European time zone.


    Entertainingly, Rossi appears to travel with a posse. There is a whole squad of others on the blog who post in the same time zone as Rossi, wherever he is. They tend to go by a single first name and write in slightly fractured English. Godspeed!

    If the medium is optically thick, radiation generated is only moving a short distance within the medium (relative to its size) before being absorbed again - the
    shape of the spectrum is set by the balance of both emission and absorption processes. In an optically thick region, this amounts to constraining the
    spectrum to be not more efficient than a black body.


    Right. Blackbody radiation assumes thermal equilibrium and I think this is saying that an optically thick plasma approximates blackbody behaviour.


    The right-hand tail of the theoretical blackbody spectrum I showed before follows the Raleigh-Jeans law. It looks like it falls off faster in your Figure 3.4 because wavelengths and intensities are shown on log scales there, but it is the same curve as I show. Rossi's SK spectrum falls off much faster.

    There are multiple weirdnesses about Rossi's January presentation of the SK, but the weirdest of all involves his treatment of the SK spectrum. Of course lots of people have noted that the spectrum doesn't look very blackbody - ish, but probably many don't understand how out-of-bound it is.


    So ... below I show a plot comparing the SK spectrum that Rossi showed in his presentation (blue) and a the theoretical spectrum (orange) for a blackbody at 8111 degrees K (note: the SK spectrum is based on a compilation of 17 screen grabs provided at http://www.electric-sailing.fi/other/EcatSK/ by Pekka Janhunen and the theoretiical curve is from a nice online calculator available athttps://astrogeology.usgs.gov/tools/thermal-radiance-calculator/ ).


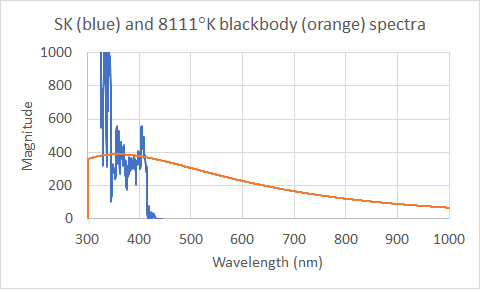
    I have done my best to fit the theoretical curve to the measured SK spectral data. Given a temperature of 8111 K, the only parameter available for fitting is the overall magnitude of the orange calculated spectrum -- the location of its peak and the existence of the long tail on the right are invariant. So I might be a little off with my fitting but I am confident that this is pretty much the best fit achievable as long as you ignore the isolated peaks at short wavelengths that appear to be individual emission lines.


    What is glaringly obvious in the plot is that the SK spectrum is missing a huge amount of power at wavelengths longer than about 420. Here is a closeup of the region where the SK spectrum just gives out bu the theoretical blackbody spectrum just keeps on rolling.


    Rossi claims he sees a peak in the SK spectrum at 357 nm. I don't really see that in the SK spectrum here although I guess you could argue that the data are at least sort of consistent with this. But the sudden collapse of the SK spectrum above about 415 nm is remarkable when compared with an actual blackbody curve. I originally wondered if this was due to a limitation of the response of the spectrometer or due to filtering of the light, but why would Rossi introduce these limitations when at the same time he is so intent on showing people the 437.2 nm peak he predicted in his recent paper.


    Perhaps we should ask Mr Rossi about all this! Well thank goodness someone has done just that. Of the more than 400 messages on Rossi's blog in the last 3 weeks since the SK production, 3 have asked where the longer wavelength have gone. The first time he was asked, by Steven Karels at 8:24 on Feb 9, Rossi's full response is ...


    A “Black Body” is a hypothetical absorber and radiator of energy, with no reflecting power. It radiates at all frequencies with a spectral energy distribution dependent on its temperature in Kelvin. Our calculation is focused only in 1 cm^2 where the plasma has the max density, while the plasma has a surface of about 330 cm^2, so to measure the power we consider only 1/330 of the plasma surface focusing conservatively only where there is the max density and the max absolute temperature. As you can see, the spectrum is more complex.

    Obviously it radiates only at the frequencies with a spectral energy distribution corresponding to the temperature in K.


    Only the final sentence of this attempts to answer Karel's question and that is not very satisfactory.


    Other answers on the same topic are ...


    - To Lotr Milekosky at 2:10AM on Feb 20 who asks if the lack of long wavelength is due to a filter ...

    No. The absence of lambda>500 nm is due to the fact that we pointed the focus only where the plasma had the highest density, in coherence with the theoretical hypothesis wrote in https://researchgate.net/publi…nge_particle_interactions"


    - To Stephen at 5:22 on Feb 20 ...

    We want not to compute also the energy of longer waves, to be conservative and focus only where the density of the plasma is highest: in https://www.researchgate.net/p…nge_particle_interactions

    In sum, Rossi's answers on this topic are either just plain wrong, or vague or misleading. The whole thing is a mess even though the spectral stuff is one of his main arguments for COP > 1


    .

    Is there a client for him? If so, then yes, it is a success.


    I will ask you a question that I also asked Matts Lewan (who did not answer). How many clients does Mr Rossi have to have to convince the world that his invention is legitimate?


    Note that I am talking about clients who are not anonymous ... my question is not even interesting if it is all just Rossisays. But if we have one or more companies who step forward to identify themselves and express their satisfaction with the heat they are purchasing, that is at least interesting. How many such companies are needed to satisfy someone who is properly skeptical of Rossi's activities ... 1? 10? 1000?


    I argue that the number is more than 1. This is because of Rossi's history of creating a fake company with a "representative" willing to do and say what Rossi wanted. Even Mr Rossi's talents in this direction would be tested, however, by having to create multiple false fronts like this. If I were to see 1000 companies self-identify and express satisfaction after 1 year's operation then I would definitely have to revise my opinion of Rossi's activities because 1) it is a large number of companies, and 2) for the whole thing to be fake Mr Rossi would have to be selling heat at an enormous loss (tens of millions of dollars?) which I don't think he would do. I suspect that even 100 companies would be enough for me.


    So. What is your number?

    You and Bruce keep hanging your hat on this one. Seems kind of tenuous to me. The flow rates measured by Alan are consistent with 3 BF @ 27k l/d, and 4 BF @ 36k l/d. And that is mostly what we see in the logs. Yeah, you guys pin-pointed a time period in the log that doesn't match up. Okay, well done. But most of the data comports


    Time to examine this again. You have agreed that only 3 BF units were working on October 13 2015 and on that day this is inadequate for the 36,0000 L/d figure recorded in Penon's report for that day. I have now found that in Penon's report there is the same type of indication that only 3 BF units were in play on the next day, October 14 2015. Yet 36,000 kg of water were again claimed to be pumped. So that day there is again a mismatch too.


    I believe that this sort of mismatch is not rare. I think that no more than 3 BF units were ever in action from August 18 2015 right through to the end of the trial on Feb 14 2016. This is a 180 day period and consulting Penon's spreadsheets I find that 36,000 L/d was claimed on 116 of them (including nearly all of October, all of November, all of January, and the 14 days of February leading up to the end of the trial).


    My reasons for thinking that BF4 was taken permanently offline on August 18 2015 are


    1) Fabiani's log last mentions BF4 on that date with an explanation that it has been isolated because of hydraulic leaks and shorting to ground


    2) Penon and Murray's attestations that BF4 was not in play in the middle of October


    3) Penon's spreadsheet showing that the input energy absorbed by the 3 remaining BF units in mid October was actually a high point. For the entire rest of the Doral test the energy absorbed by the plant was lower than at this time.


    4) Photos of the pumps taken near the end of the trial show that BF 4 ended up shut down and dry. In contrast to the rest of the setup the plumbing for BF4 (the bottom BF) had the thermal insulation stripped away and reconfigured. The sight glass on the unit is clean and no meniscus is visible.


    Since Penon report 36,000 L/d being pumped on 114/180 days following Aug 18 2015, I conclude that there is a mismatch between the capacity of the 18 remaining pumps and the amount claimed to be pumped for a major part of the time. That is, it is not true that "most of the data comports" during this period. Instead, very little of it does.


    I have mostly not cited particular documents as I went through my argument here. That was for clarity of exposition. If you want to know exactly where to look for all the information on a particular point then let me know and I will produce it.

    Entering my meditation period now. Hoping for enlightenment.


    I hope that your the mediation was productive. Let's see.


    Before, you said that the velocity of steam emerging from Rossi's hose (at a claimed 7kg/h) in the Krivit video was "in the ballpark" of that emerging from a hose at a measured 5.7 kg/h. Here are the 2 videos side by side. I have linked to them such that they both start with comparable shots of the steam and hose. I can't even hear the steam in the Krivit video but it is loud in the other video.


    Do you still claim that these velocities are in the same ballpark? I know I have asked this before but I thought your answer was vague and evasive. I would like you to answer again after I have done my best to create conditions in which fair comparisons can be made. I think that the velocity of steam in the Krivit video is multiple times less than in the other one.


    P.S. For some reason I can get the 5.7 kg/h video to start at the point I want but not the Krivit video. So please begin viewing the Krivit video at 11 minutes and 29 seconds. That will produce the comparison I intended


    External Content www.youtube.com
    Content embedded from external sources will not be displayed without your consent.
    Through the activation of external content, you agree that personal data may be transferred to third party platforms. We have provided more information on this in our privacy policy.

    B4 was altered in July & August (Fabiani log).


    11.Aug.2015

    (4 reattori funzionali: BF1,2,3 al 40% il BF4 al 30%)

    (4 functional reactors: BF1,2,3 at 40% BF4 at 30%)


    Hi Alan. For future reference, I have created a document that lists english translations of all comments in Fabiani's log. I don't know Italian so this was all done using google translate.


    Fabiani log comments - from Rossi v Darden court document 207-55.txt


    I note that the last mention of BF4 in the record is on August 18 when Fabiani says it has been isolated from the system for reasons that appear to involve short circuits. We know that about 2 months later BF4 was definitely offline and that by the end of the Doral test that it appears to be dry and have had its plumbing reconfigured so I think it is reasonable to suppose that it was permanently taken off line on August 18.

    In the Rossi as JMP deposition, which I have as Document 326 Page 171 of 300, deposition pages 91 through 95, Rossi seems to describe the mezzanine heat exchanger as being re-used in the Doral premises for another purpose. In another plant at the same location.


    The heat exchanger in the mezzanine is the one in the black container imagined to the upstairs room to mansplain the severe heat issues, IMHO.


    The piping was still in the warehouse, and being used for something. Since it was not in a giant pile of pipes which could be pointed out as being the former upstairs exhanger,it had to be in plain site somewhere else. The black box. It was probably hoped that Schrodinger-like uncertainty would hold for the question of the contents the black box during the Doral Plant period, so it could be shown that the pipes could have been moved into there. Except they were seen within, prior to the end, when they were supposed to be upstairs. So instead the pipes just disappeared into the same field disturbance of the Dirac sea they originally spontaneously formed from, closing the loop, but leaving within our universe a trail of anti-information that annihilates to pure disinterest when it meets equal amounts of information....


    There was a set of large pipes that appeared at some point after the Doral test ended. They hung on the wall near the JMP black box and reached up and partly across the ceiling. There are not quite enough of them there to make up the claimed mezzanine heat exchanger but they are of the right diameter.

    And yours are specially adapted to come to the conclusion you desire.


    Truly, my assumptions are not slanted in this way. The very reason I like the Krivit video is that people can carry out measurements and directly compare the results with what Rossi claims. Anyone else can do the same. When I started the measurements and calculations (and assumptions) I did not really know how they would turn out and would have reported everything regardless of the results. If you go back an look at the assumptions I make they are just standard physical assumptions.


    For example, when I provide a remarkable observation such as the aggregate pump rate as measured by Alan NEARLY EXACTLY matches the pump rates of the BF3 and BF4, it's almost entirely lost on you and other hyper-skeptics.


    This isn't an assumption, it is an observation. But it fails to differentiate between the 2 alternatives I am interested in ... Rossi faking thing or Rossi is the real deal. In particular, if Rossi is a fake then the reason you see a match between the claimed 36,000 L/d and the output of 24 pumps is that Rossi planned it this way. You need to realize that in the original configuration of the Doral plant there were actually upwards of 75 pumps and that even at 32 L/hr these would easily easily have pumped the amount of water corresponding to the 1 MW of heat that Rossi was interested in generating. That initial configuration lasted up to the day before the 1-year test actually began. On that day (the day after Penon had left after hiss first site visit) Rossi radically reconfigured the plant by closing down all the small ecats and their pumps This left only 24 pumps on the BF units. But these were just enough to push 1 MW of water through the system. As Rossi said in his post trial interview with Mats Lewan, he had years and years of experience with pumps of this type and knew their capabilities.


    I told you my view. But I guess you continue to insist that I don't respond to your critiques, so I'll give you a bit more: you post a video and claim it is 6kg/hour, but we have no idea about who made that video, whether it is accurate, whether it was independently checked, who is behind it, etc. And to be honest, while it does appear to have a bit more oomph, it is in the ballpark of what we observe with Rossi's hose.


    I apologize for not seeing your previous reply on this. I looked for it but couldn't find it.


    If you look at the 6 kg/hr video you will see that the 6 kg/hr figure is not an assertion ... it is a result of calculations that use measurements made in the body of the video. In the video the operator sparges the steam for 60 seconds into a weighed bucket of water and notes the change in temperature this evokes. This is an absolutely standard way off assessing the amount of energy in steam. It is the sort of thing that Penon should have done. Using the measurements and the heat capacity of water you can then find the energy in the steam. Making these calculations shows gives 5.7 kg/hr of steam.


    The velocity of steam coming out of the hose in the 6 kg/hr video is much greater than coming out of Rossi's hose. Much greater. You are not being honest when you say it is in the ballpark and I think you need to think about this within yourself.